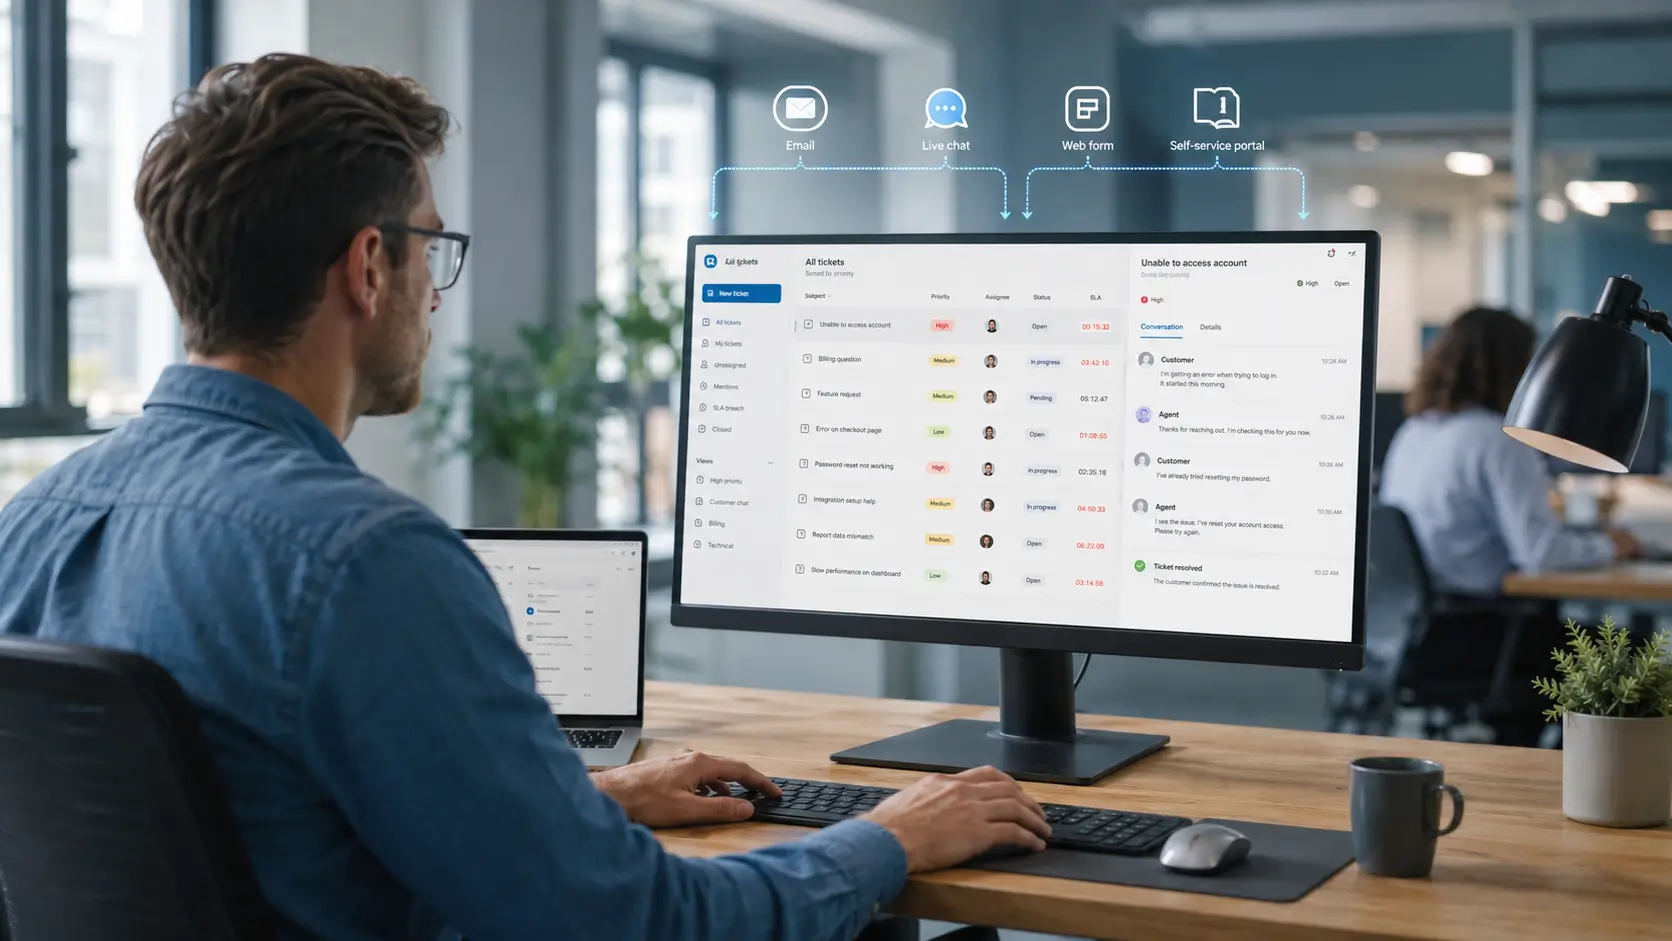
SLA compliance reporting answers a simple but vital question: are we keeping our service promises? For managers, it turns daily ticket activity into a clear picture for leadership.
This guide explains what SLA compliance means, how to calculate it, and what a useful report includes. It is written for team leads and managers who need to report results upward.
SLA compliance is the degree to which your team meets its agreed service deadlines. It is usually expressed as a percentage of tickets that met their SLA.
A high compliance rate means promises are being kept. A falling rate is an early signal that something in the process needs attention.
Compliance is the headline number leadership cares about. It connects daily support work to the commitments the business has made, and it is the proof step in the complete guide to SLA management.
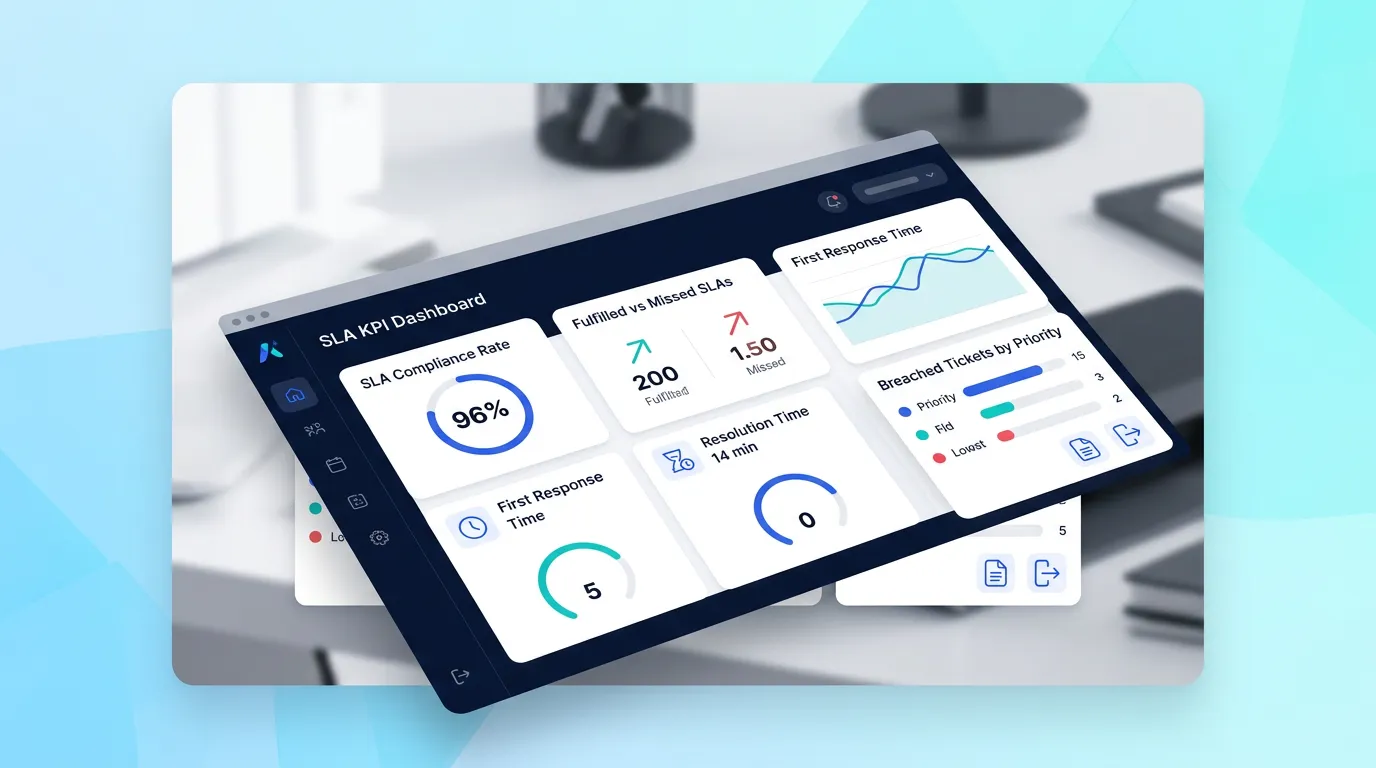
SLA compliance reporting dashboard showing compliance rate, breached tickets, response time, resolution time, and trends.
The formula is straightforward. You do not need complex math to track it.
SLA compliance rate = (tickets that met their SLA / total tickets) x 100.
For example, if 920 of 1,000 tickets met their target in a month, compliance is 92 percent. You can calculate it for response time, resolution time, or both.
Track the rate by priority too. A strong overall number can hide poor performance on critical P1 tickets, which matter most.
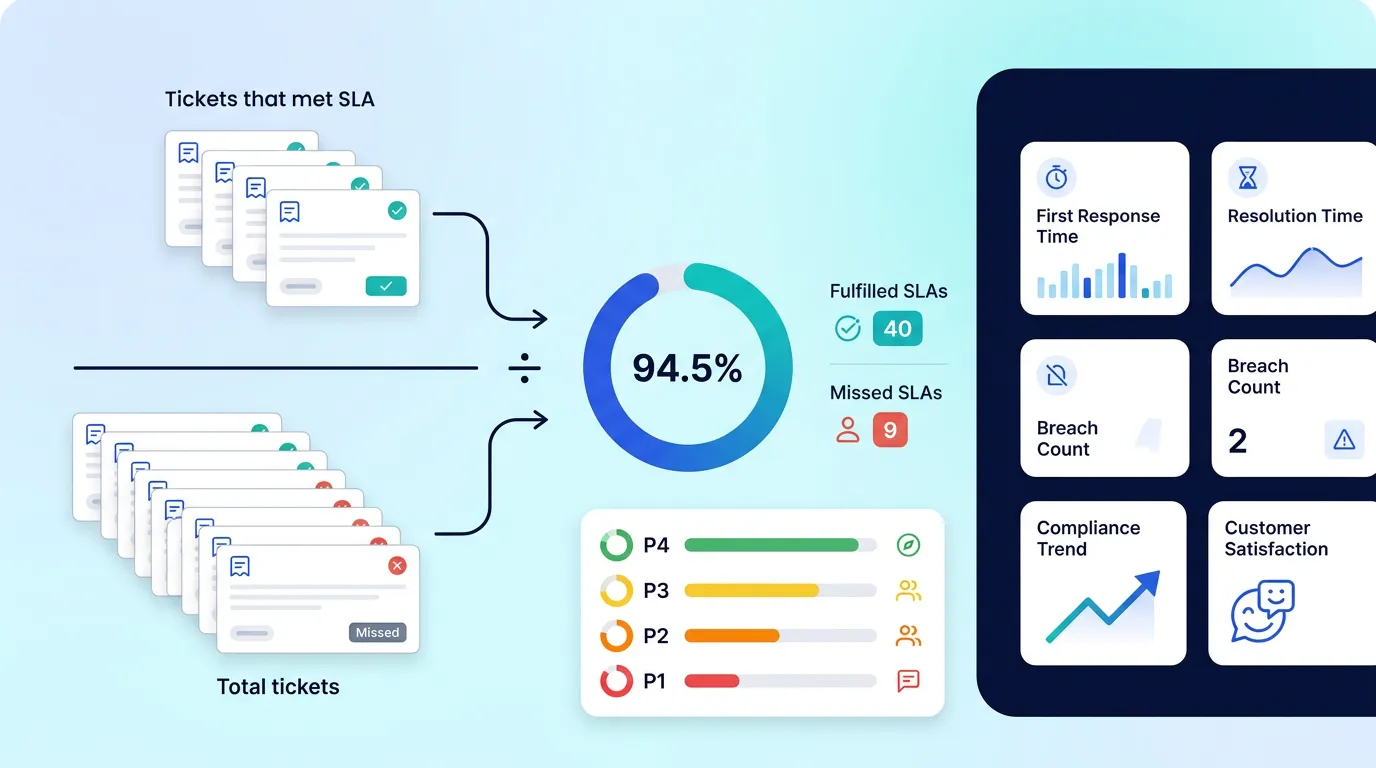
SLA compliance rate calculation with fulfilled tickets, missed SLAs, response time, resolution time, and priority breakdown.
A useful report shows more than a single percentage. It gives context that drives decisions.
Keep it focused. A report crammed with every metric buries the insight that matters.
A few numbers carry most of the meaning. Here is what each tells you.
The compliance rate is the summary, and breaches by priority show where it is failing. Together they tell you both the score and the weak spot.
These show how fast the team works. Watching them alongside compliance reveals whether speed or process is the issue.
A single month is a snapshot. The trend over several months shows whether changes are helping, which is easier to see when you track SLAs in real time rather than waiting for the period to close.
Reporting cadence depends on the audience. Different people need different views.
Agents and team leads benefit from a live dashboard and a weekly summary. It keeps the queue under control day to day.
Leadership usually needs a monthly or quarterly report. They want the trend and the headline compliance rate, not ticket-level detail.
Match the depth to the reader. Frontline views are detailed and frequent, while executive views are high-level and periodic.
A report only earns its keep if it changes something. The goal is improvement, not record-keeping.
If compliance is slipping on P1 tickets, the fix may be faster routing or earlier escalation. If one category breaches often, a new help article could reduce its volume.
End every review with a decision. Name what will change before the next reporting cycle.
A light, repeatable rhythm keeps reporting sustainable. It does not need to be heavy.
Glance at the live dashboard daily to catch problems early. Summarize trends weekly with the team, and report compliance and direction to leadership monthly.
This layered cadence gives each audience the right information without drowning anyone in numbers.
A few habits weaken SLA reports. They are easy to fix once you spot them.
The first is reporting a single number with no trend. One month’s compliance rate means little without the direction over time.
The second is hiding critical misses inside an overall average. Always break compliance down by priority, so P1 failures are visible. Pairing reports with AI ticket analytics makes those patterns surface faster.
The third is producing reports no one acts on. If a review ends without a decision, the reporting effort is wasted.
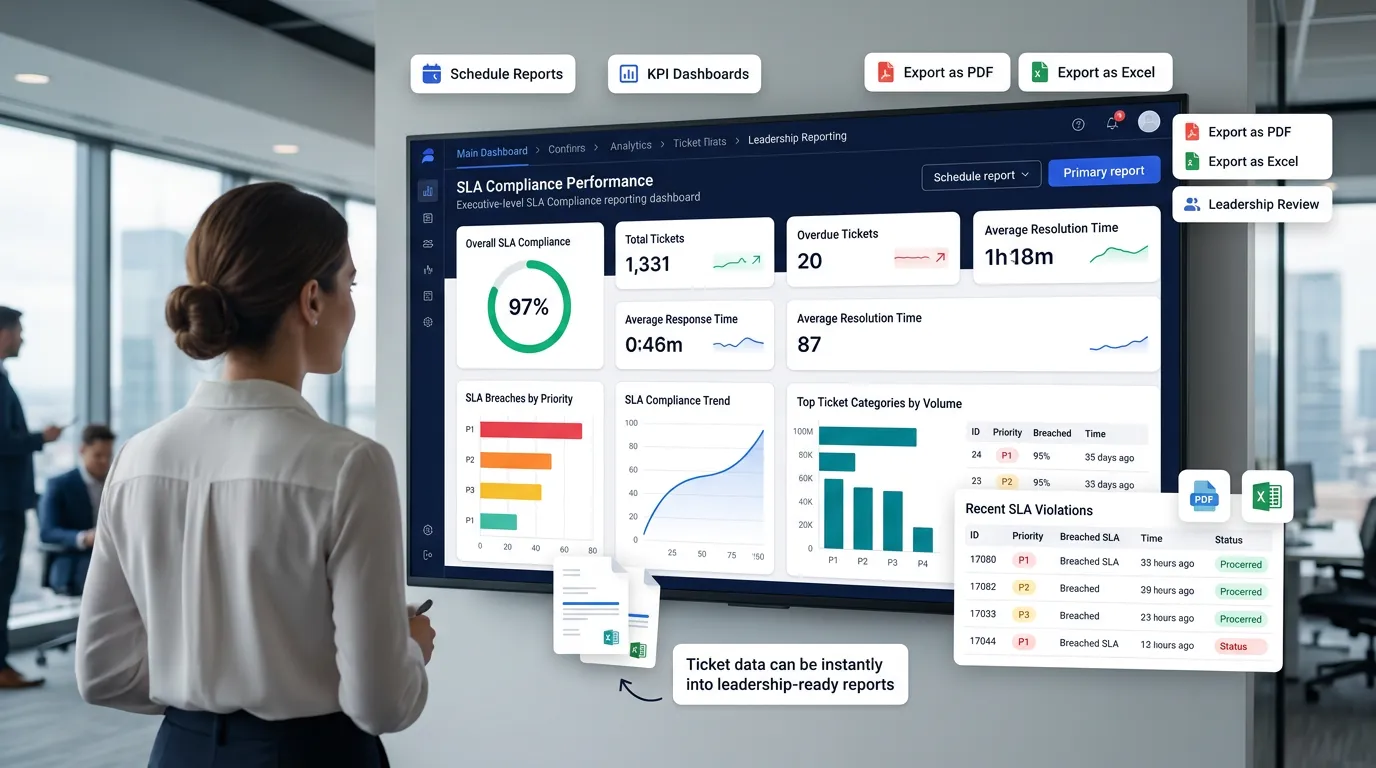
Manager SLA reporting dashboard with scheduled reports, KPI summaries, PDF export, Excel export, and leadership insights.
Hengine SDP tracks SLA compliance in real time and turns it into reports. The Intelligent Dashboard shows compliance, overdue tickets, and average response and resolution times at a glance.
For formal reporting, Analytics and Reports offers customizable, period-based reports with KPI dashboards and scheduled delivery. Managers can export results in PDF or Excel for leadership and audits, turning ticket activity into decisions backed by data.
Next step: Report SLA performance with confidence. Start with Hengine’s free Fremium plan or book a demo to see compliance dashboards and exportable reports.
How do you calculate SLA compliance rate?
Divide the number of tickets that met their SLA by the total number of tickets, then multiply by 100. You can calculate it for response time, resolution time, or both, over any period.
What is a good SLA compliance rate?
It varies by industry and contract, but many teams aim for the high 90s on critical tickets. The right target is one agreed with your customers and achievable for your team.
What should an SLA report show leadership?
Keep it high-level: the overall compliance rate, breaches by priority, key response and resolution times, and the trend over time. Leadership wants direction and risk, not ticket-level detail.
How often should I report on SLAs?
Use a layered cadence. Check a live dashboard daily, summarize trends weekly with the team, and report compliance and direction to leadership monthly or quarterly.