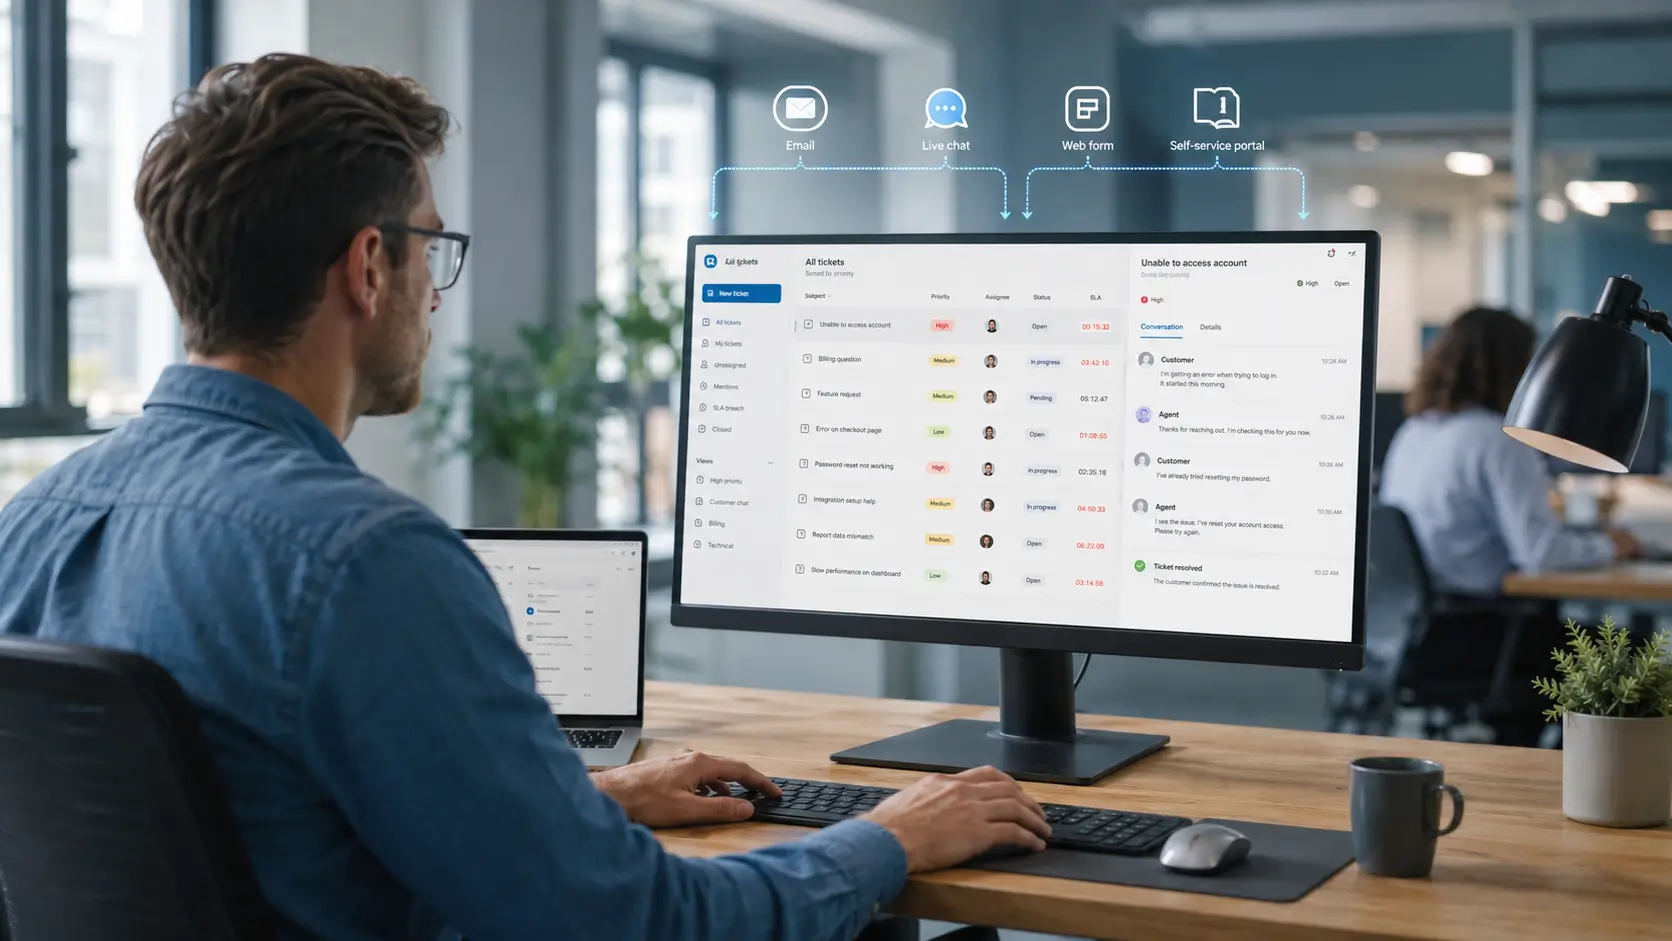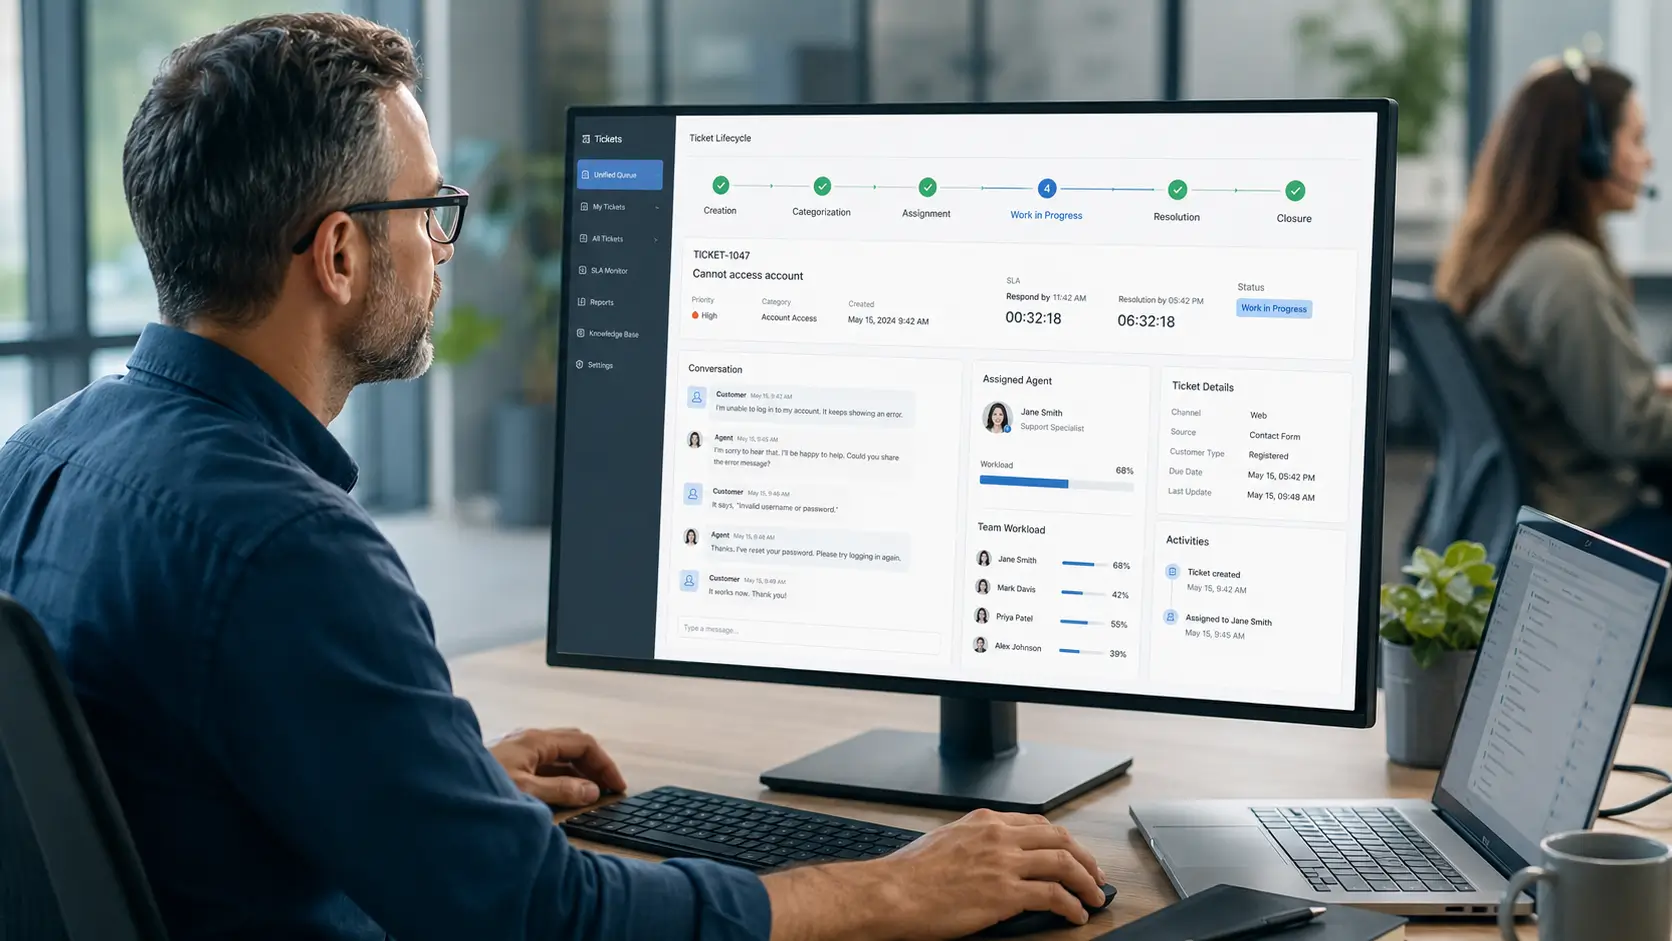

It is easy to drown in support data. The hard part is knowing which numbers actually tell you something.
The right metrics show whether customers are happy, agents are coping, and service is improving.
This guide explains the help desk metrics and KPIs that matter, what each one means, and how to use them.
Metrics turn a busy support team into a measurable operation. Without them, you are guessing.
They reveal where tickets pile up, how fast you respond, and whether customers are satisfied. That insight drives real improvement.
The goal is not more data. It is a few numbers you act on.
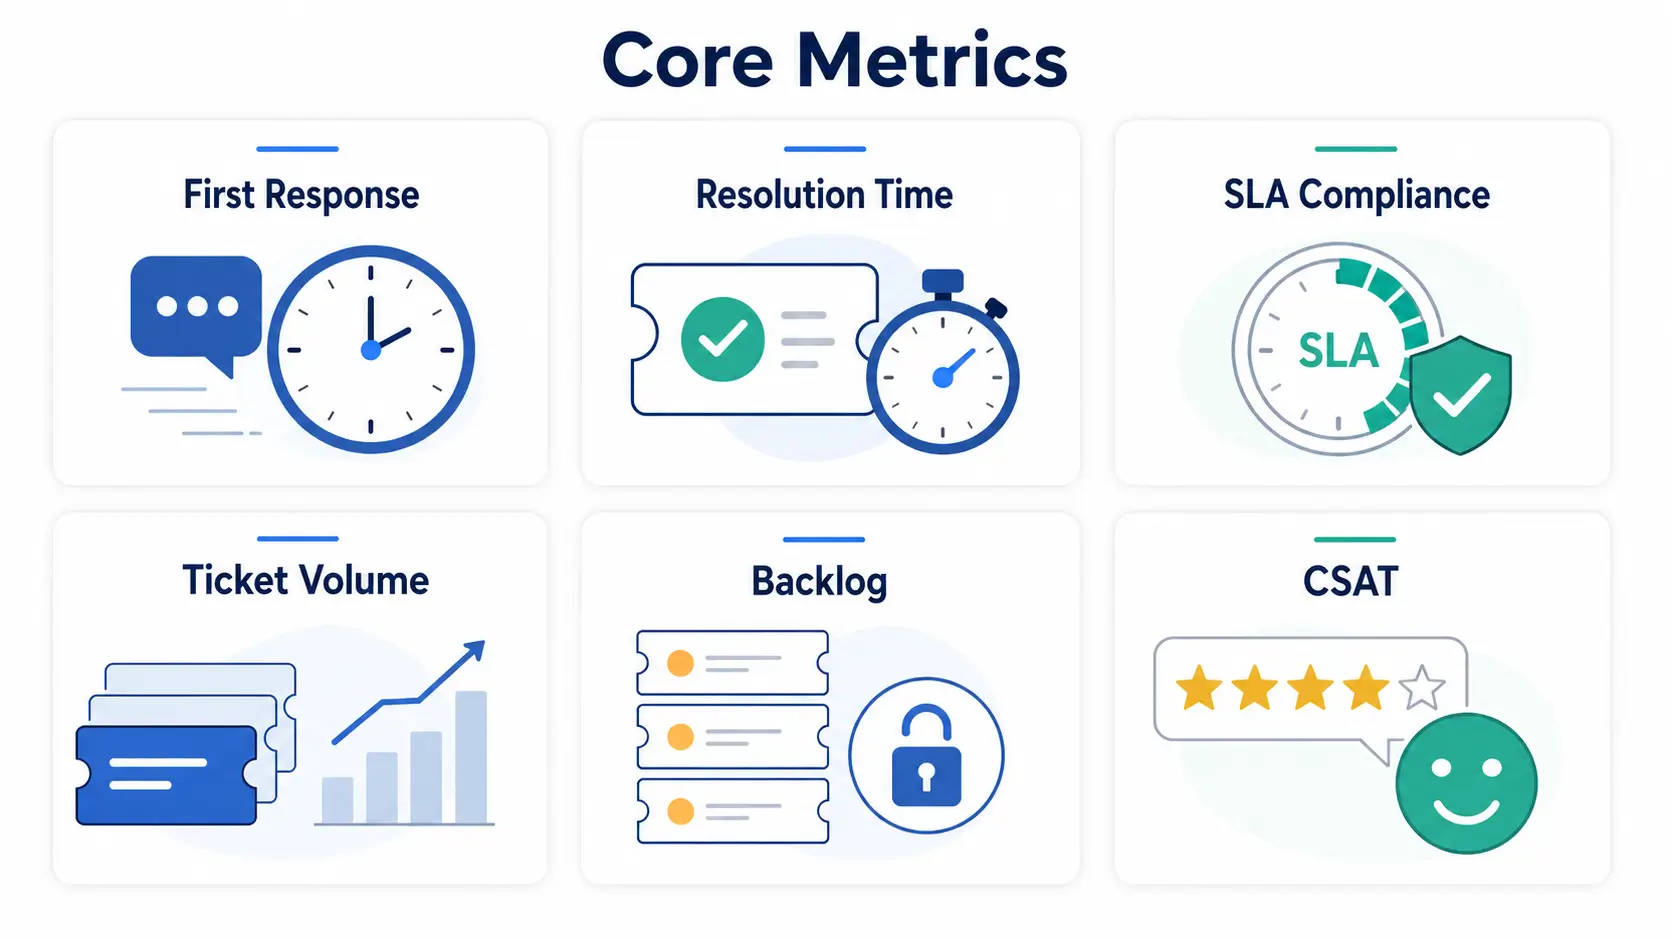
Start with these essentials. They cover speed, quality, and volume.
| Metric | What it measures | Why it matters |
|---|---|---|
| First response time | Time to the first reply | Sets the tone for the whole ticket |
| Resolution time | Time to fully resolve | Shows overall efficiency |
| SLA compliance | Share of tickets meeting targets | Tracks reliability of service |
| Ticket volume | Number of tickets over time | Reveals demand and trends |
| Backlog | Open, unresolved tickets | Signals capacity problems |
| CSAT | Customer satisfaction score | Measures how customers feel |
First response time
Resolution time
SLA compliance
Ticket volume
Backlog
CSAT
Speed shapes how support feels to customers. Two metrics lead here.
This is how long a customer waits for the first reply. Fast first responses reassure people their issue is being handled.
This is how long the full fix takes. Track it by priority, since complex issues fairly take longer.
Speed means little if the answer is wrong. Quality metrics balance the picture.
CSAT asks customers to rate their experience, usually after a ticket closes. It is the clearest signal of how support feels.
This is the share of tickets solved in one interaction. High rates mean fewer frustrating back-and-forths.
These show whether your team can handle the demand.
Track volume over time to spot trends and peaks. It guides staffing and planning.
A growing backlog signals undercapacity or poor routing. Watch it alongside agent utilization.
Beyond speed and quality, a few metrics show how efficiently you run.
This shows how much each agent handles. Read it with quality scores, so speed does not come at the cost of good answers.
This divides support costs by ticket volume. It helps justify tools and staffing, and shows the value of deflection.
This is the share of questions solved without an agent. A strong knowledge base raises it and lowers cost per ticket.
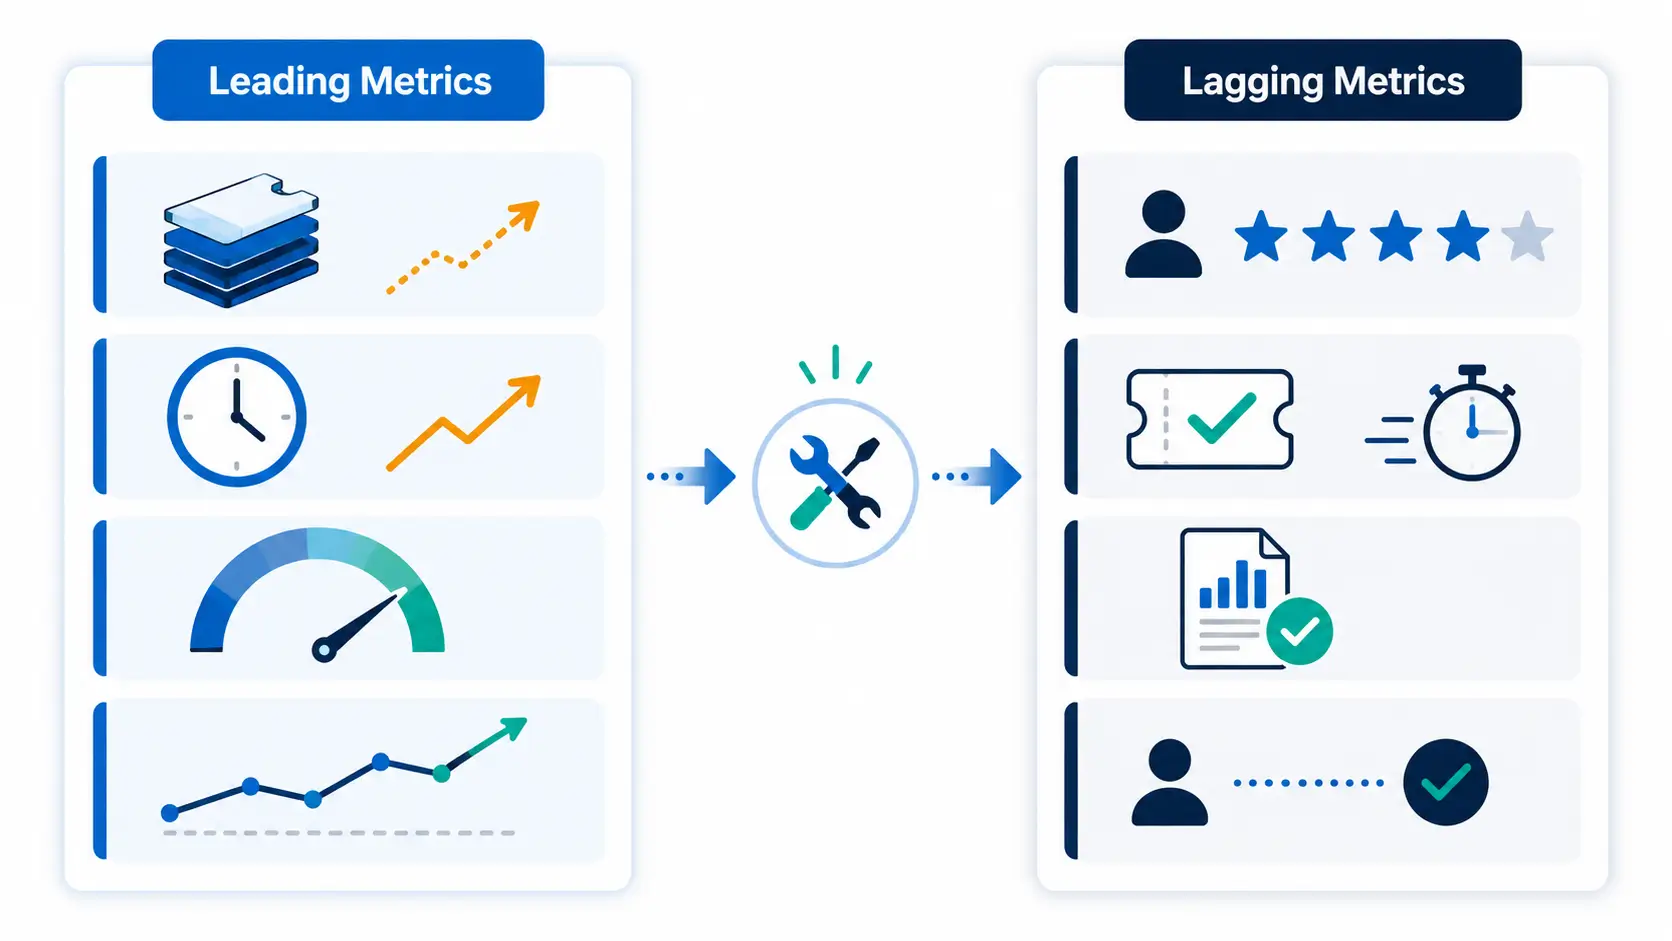
Some metrics predict problems; others confirm them after the fact. Use both.
Backlog growth and rising response times are leading signals. They warn you before satisfaction drops.
CSAT and resolution time are lagging signals. They confirm the outcome once the work is done. Watching leading metrics lets you act sooner.
Metrics only help if they lead to action. Use them deliberately.
Dashboards make this easier by showing live numbers at a glance. analytics and reporting guide
First response time, resolution time, SLA compliance, and CSAT are the core. Add volume and backlog to understand workload.
It depends on channel and expectations. Set targets by priority and measure against them consistently, rather than chasing one universal number.
CSAT measures satisfaction with a specific interaction. NPS measures overall loyalty to the brand. Both are useful, for different questions.
Weekly for operational metrics, and monthly for trends. The cadence matters less than acting on what you see.
Yes. Tracking everything leads to acting on nothing. Focus on a few metrics tied to clear goals.
Choose a few metrics that match your goals, baseline them, and review regularly. Let the data guide one change at a time.
To track these metrics on live dashboards, explore how Hengine reports on support performance.