Support teams generate a lot of data, but data alone does not improve service. Analytics turns that raw ticket history into insight that a manager can act on.
This guide explains support ticket analytics in plain terms. It covers the key metrics to track, how AI improves reporting, and how to build a dashboard that drives decisions.
This article covers help desk and support analytics, not event or concert ticket sales. The metrics here describe customer and internal support performance.
Ticket analytics is the practice of measuring and analyzing support requests to understand performance. It answers questions like how fast you respond, where backlogs form, and which issues recur.
The goal is to move from gut feel to evidence. Instead of guessing where the team struggles, you see it in the numbers.
Good analytics also looks forward. It does not just report what happened; it helps you predict and prevent problems.
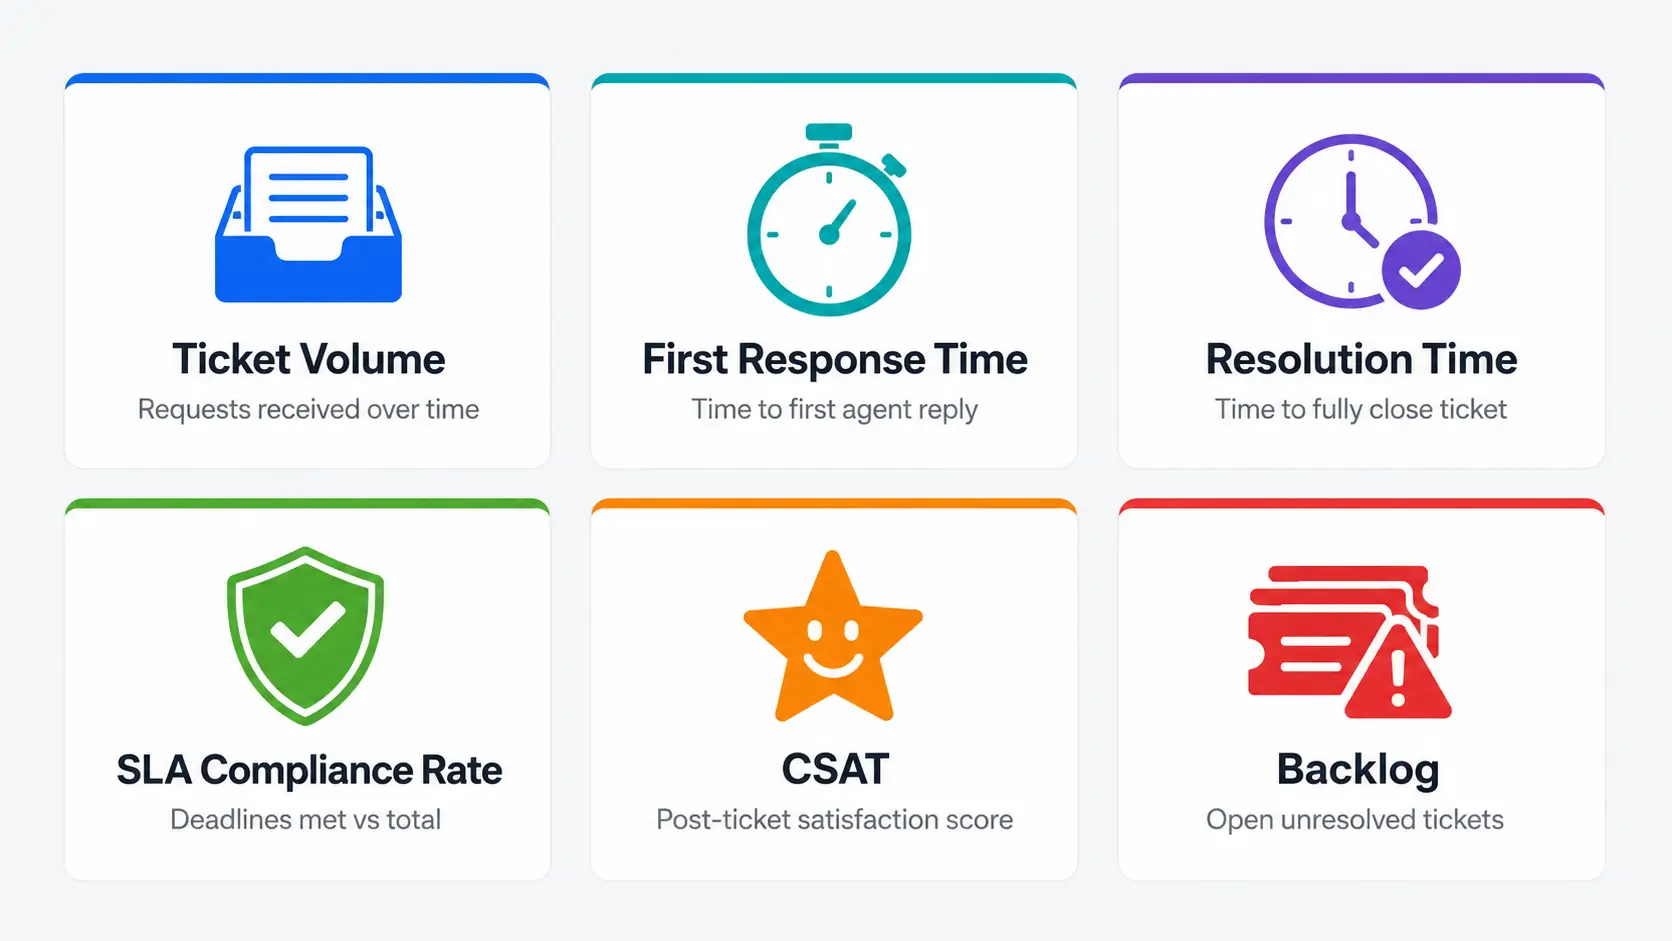
A handful of metrics cover most of what matters. Here they are in plain English.
You do not need to watch all of them daily. Pick the few that match your current goals and review the rest periodically.
A closer look helps you use these numbers well.
Ticket volume shows demand on the team. Watching how it changes over time reveals seasonal spikes and the impact of product changes.
These two measure speed. First response time shapes the customer’s first impression, while resolution time reflects the real outcome they care about.
Compliance shows whether you are keeping your promises. A growing backlog is an early warning that demand is outpacing capacity.
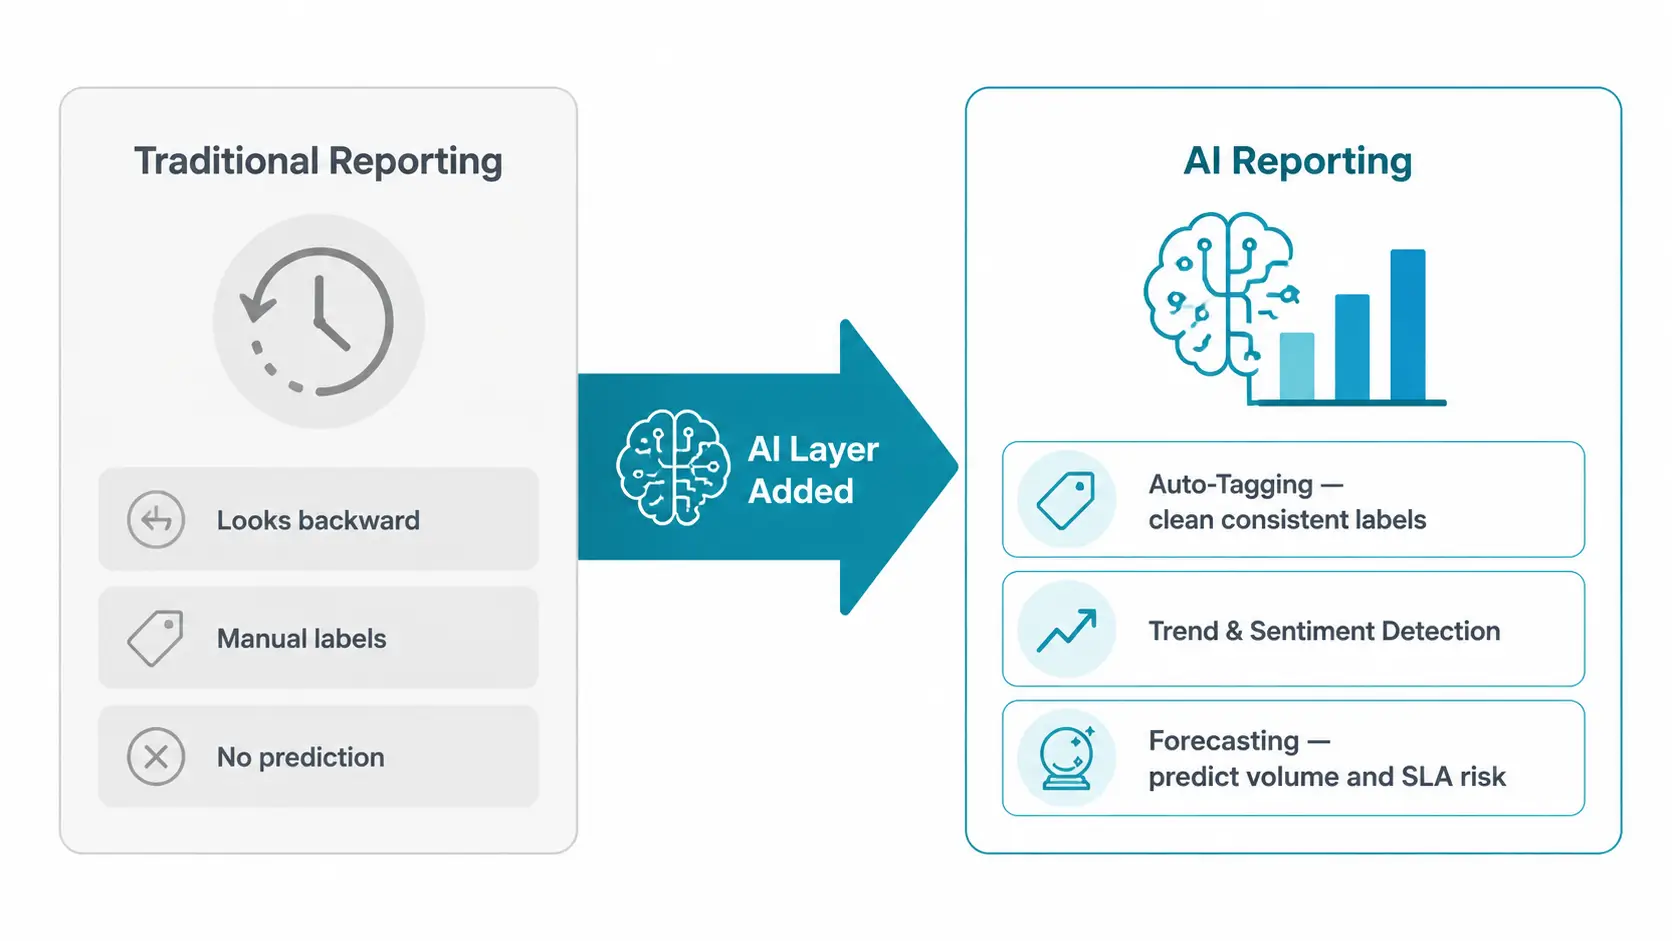
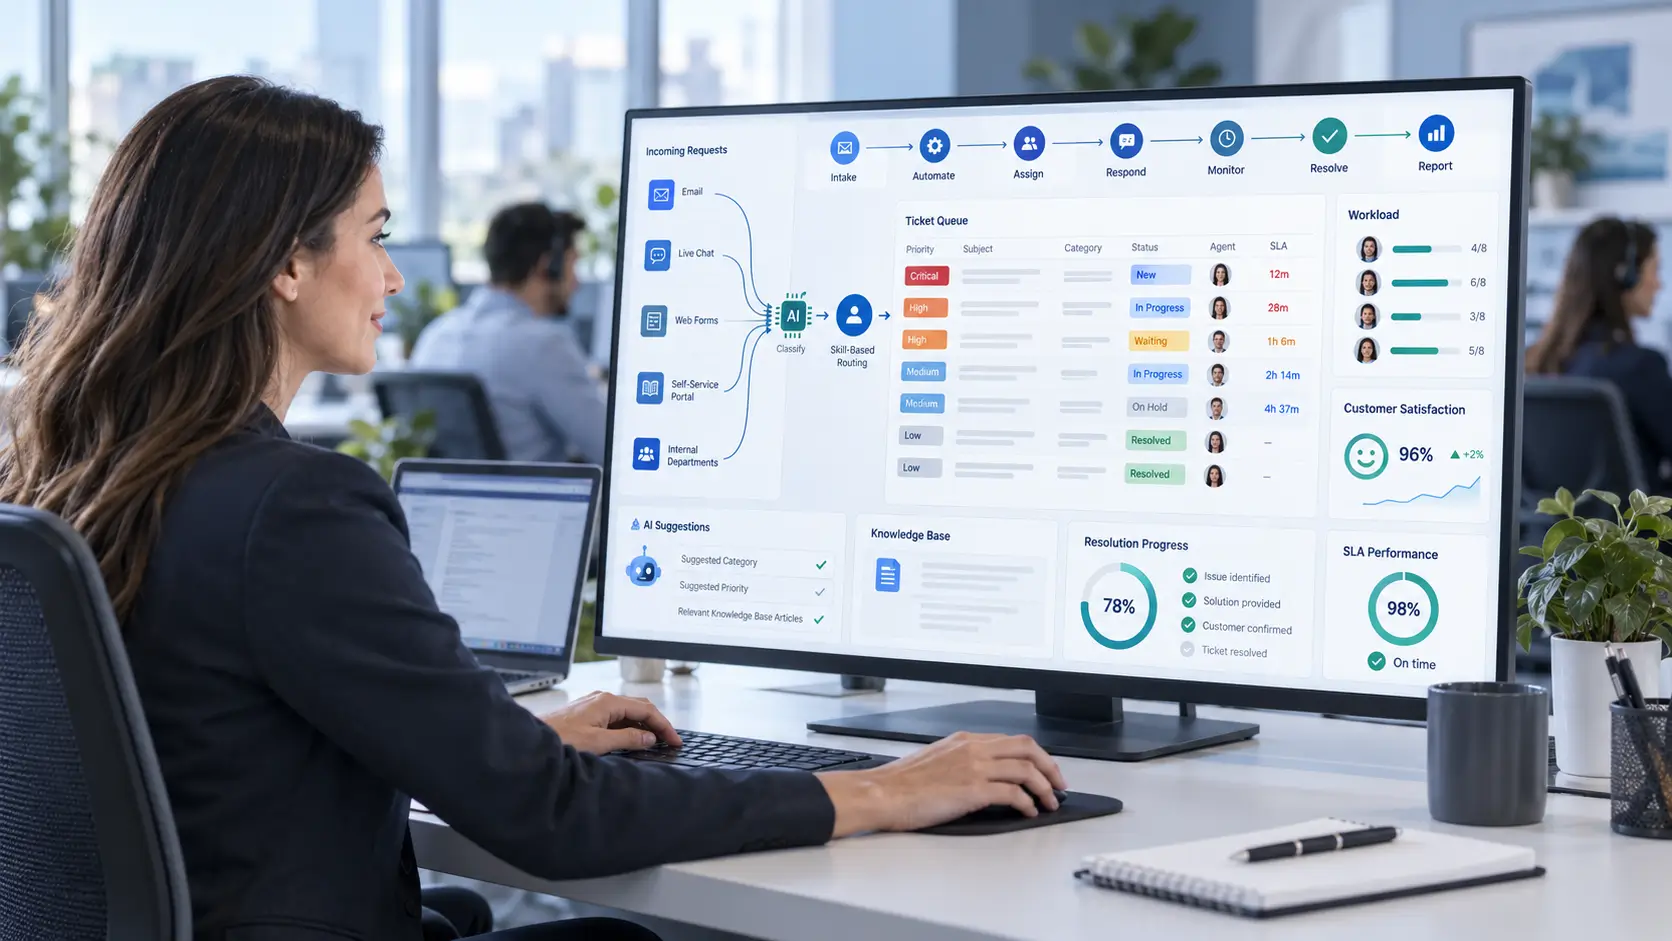
Traditional reporting tells you what already happened. AI adds speed, pattern detection, and prediction.
AI tags tickets by topic as they arrive. Clean, consistent tags make every report more accurate without manual labeling.
AI spots patterns a person might miss, such as a rising cluster of complaints about one feature. It can also gauge sentiment to flag frustrated customers.
By learning from history, AI can forecast volume and risk. It can predict busy periods and flag tickets likely to breach their SLA.
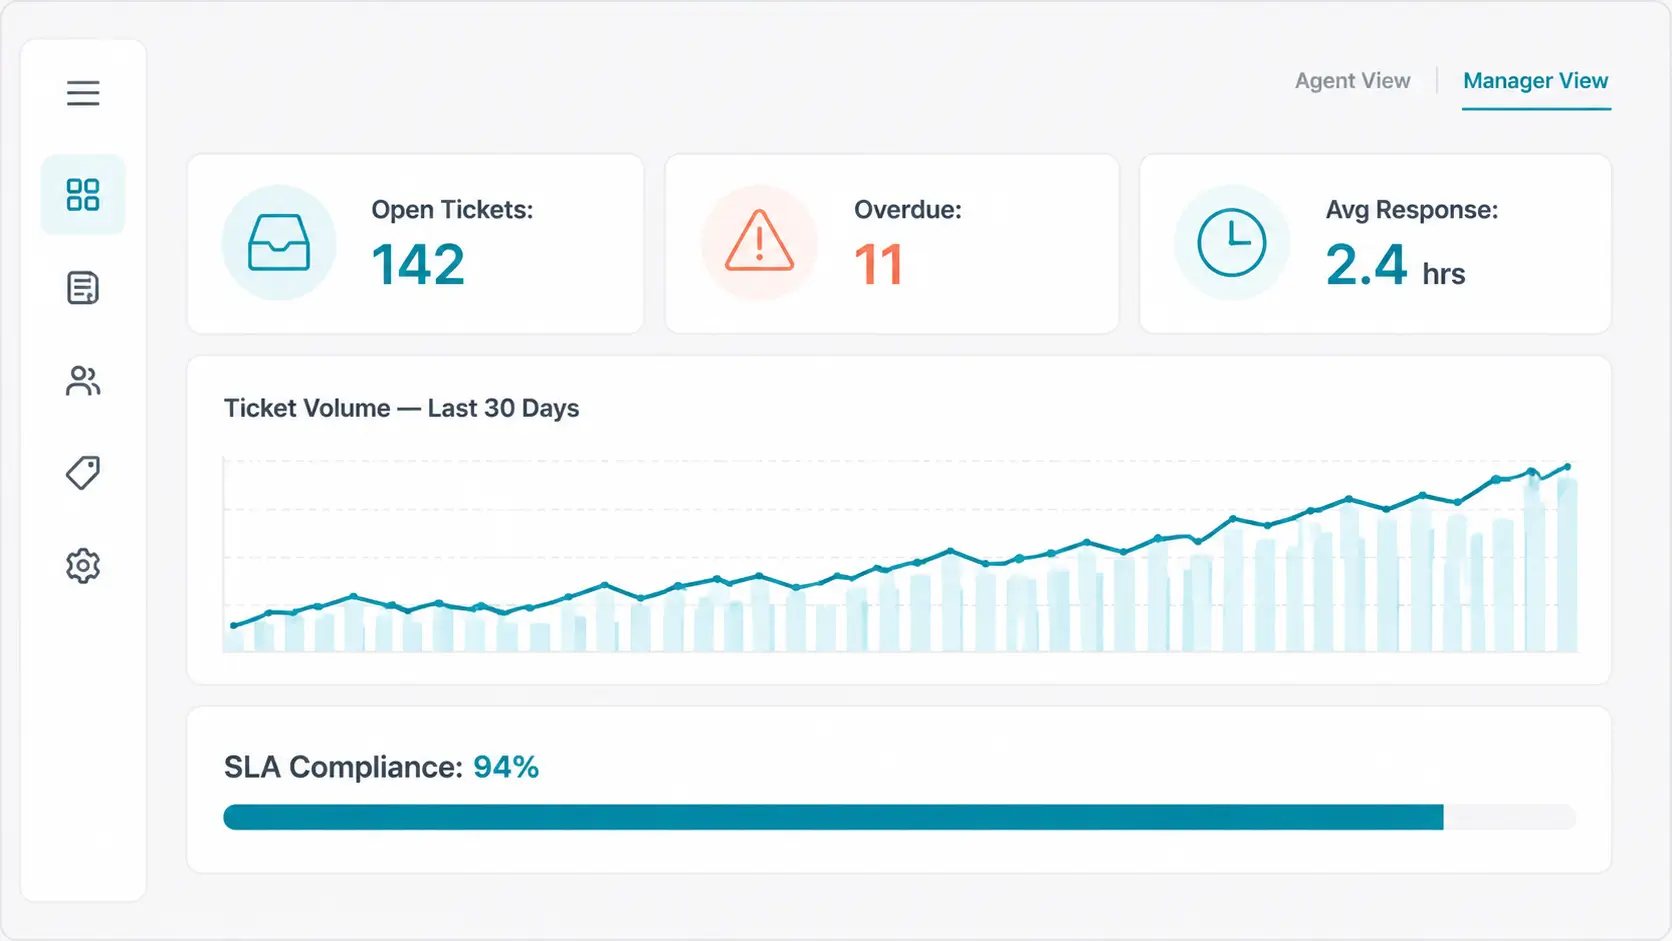
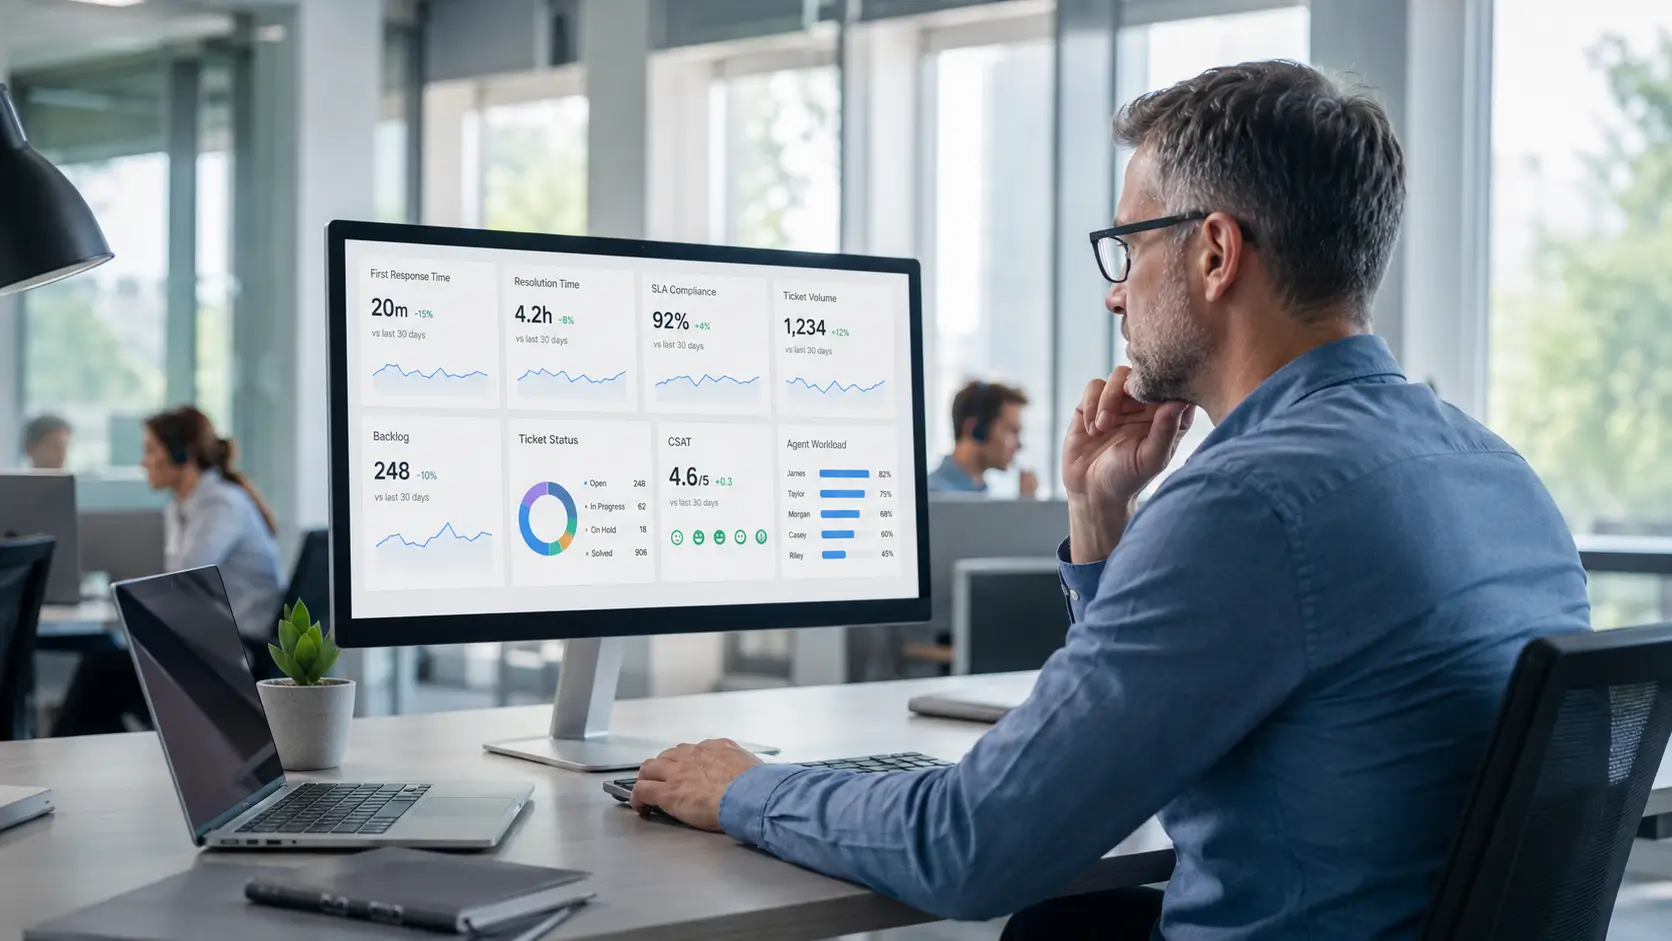
A dashboard turns metrics into a daily decision tool. The trick is to show what drives action, not every number you have.
Start with a few headline metrics: open tickets, overdue tickets, and average response time. These tell you the state of the queue at a glance.
Add SLA compliance and volume trends for the bigger picture. Keep the layout simple, so the team reads it in seconds.
Finally, tailor views by role. An agent needs their own queue, while a manager needs team-wide trends.
Reports only matter if they change something. The point of analytics is better decisions, not prettier charts.
If the first response time is rising, you may need automation or more coverage at peak hours. If one category dominates volume, a new help article could deflect it.
Review the numbers on a regular cadence, then act on what they show. A weekly look at trends keeps small problems from growing.
A few habits make analytics less useful than it should be. They are simple to correct.
The first is tracking vanity metrics. A big ticket count looks impressive but says little, so focus on numbers that point to a decision.
The second is reporting without context. A single week’s figure means little on its own, so always compare against a trend or target.
The third is collecting data but never acting. A report that no one uses is wasted effort, so end every review with a clear next step.
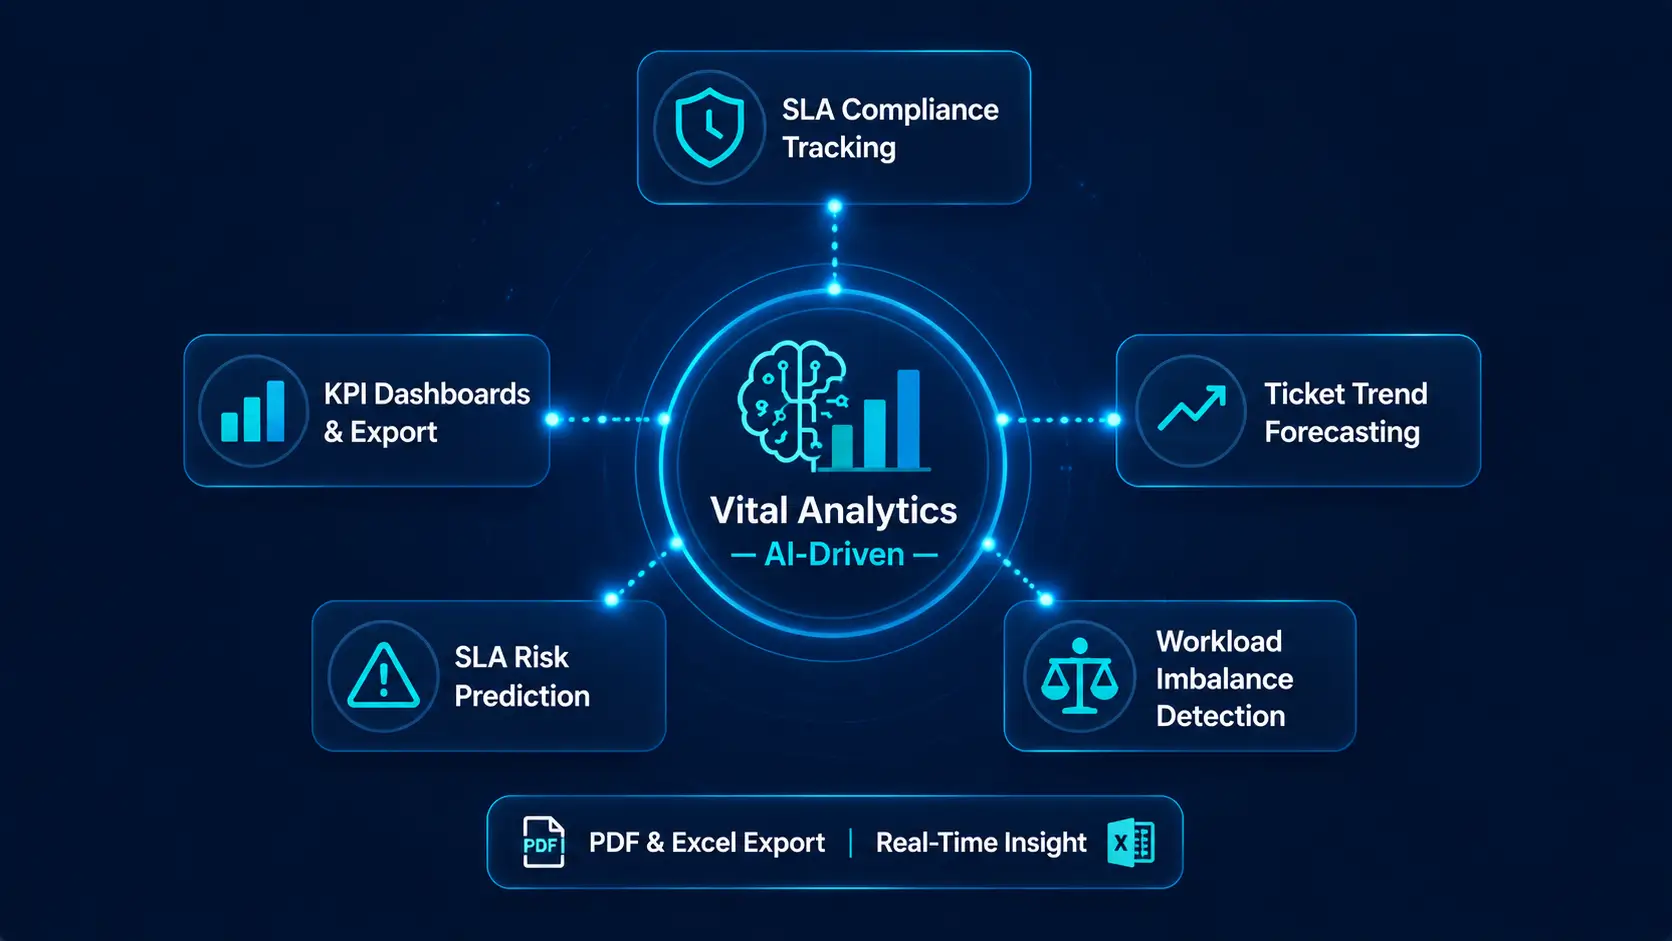
Hengine SDP includes Vital Analytics for real-time insight. It tracks SLA compliance, ticket trends, department workload, technician performance, and average response and resolution times.
Its AI-driven layer adds SLA risk prediction, workload imbalance detection, and trend forecasting. Managers can build KPI dashboards and export reports in PDF or Excel for leadership and audits.
See also: The Complete Guide to AI Ticketing Systems and Track SLAs in Real Time.AI Analytics & Reporting feature section.
Next step: See your support performance at a glance. Start with Hengine’s free Freemium plan or book a demo to explore real-time analytics and reporting.
There is no single answer, but first response time, resolution time, and SLA compliance are the core three. Together, they show whether you are fast, effective, and keep your promises.
Normal reporting looks backward at what happened. AI analytics adds automatic tagging, pattern and sentiment detection, and forecasting, so you can predict and prevent issues, not just record them.
No. This is support and help desk analytics, which measures service performance. It is unrelated to selling tickets for events, concerts, or venues.
A quick daily glance at the dashboard keeps the queue under control. A deeper weekly or monthly review of trends helps you adjust staffing, automation, and targets.
“AI Ticket Analytics” within the SLA Management cluster’s reporting article.